Detecting drum hits
The building blocks of drumming are rudiments much like scales are to any melodic instrument. A simple but clean single stroke roll can make you sound like a pro.
I normally practice with a metronome but you can get more sophisticated. There are apps that provide visual feedback for every hit (“am i lagging, rushing or on the beat?”) so you can adjust accordingly while practicing. I decided to build my own.
Goal: Extract hit times and amplitudes from a drum recording.
How accurate are conventional methods? The idea is to do my own classification (is it a ghost note, accent note, etc.) without AI and see how it performs. I’ll add more sophistication in v1.
For now, the script will analyze a file. The use case requires real-time analysis but it’s unnecessary at the moment. Here is the github repo and a simple skeleton:
Preprocessing audio:
- load_audio - get samples into
numpyarray - compute_envelope - smooth the signal
Hit detection:
- detect_onsets - find where hits occur
- measure_hits - get amplitude at each hit
Analysis:
- classify_dynamics - classify each hit as either ghost, normal or accent
After some trial and error, the script works okay. Here are the samples I was testing with. They’re not ideal but I needed something to make sure the basics work. Even without listening to the sample, the charts below aligns with the wave:
https://freesound.org/people/George_Papargyris/sounds/837177/
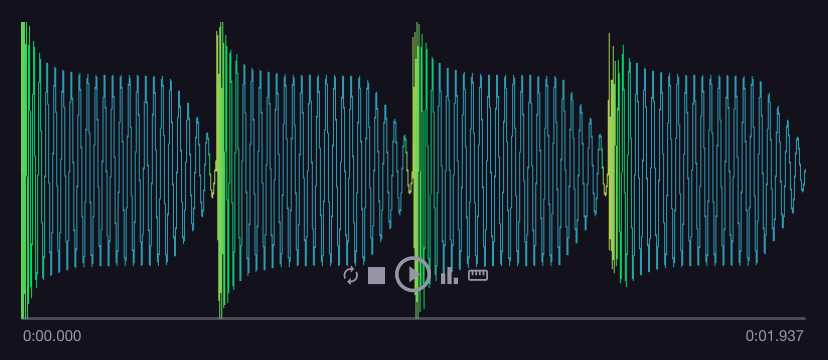
Classified dynamics:
  0.000s: 1.0000 (normal)
  0.464s: 0.9101 (normal)
  0.952s: 1.0000 (normal)
  1.463s: 0.8162 (normal)
https://freesound.org/people/Stereo%20Surgeon/sounds/266093/
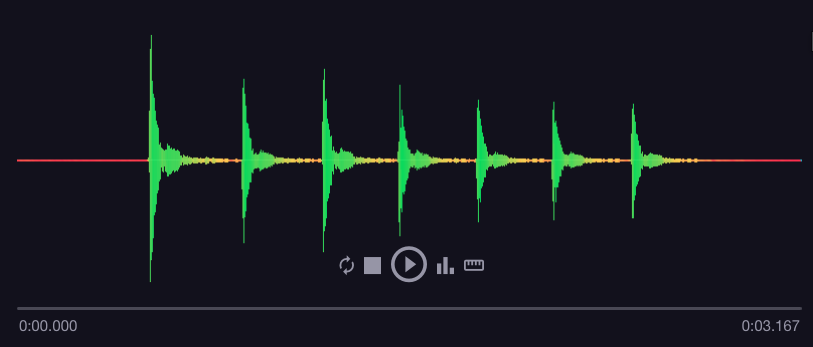
Classified dynamics:
  0.523s: 1.0000 (accent)
  0.896s: 0.6536 (normal)
  1.216s: 0.7281 (accent)
  1.525s: 0.6003 (normal)
  1.845s: 0.4840 (normal)
  2.144s: 0.4746 (ghost)
  2.464s: 0.4559 (ghost)
First, let’s define an envelope. Raw audio signals are jagged–falling and raising chaotically since they’re recorded at specific intervals (like 44.1 kHz). The goal is to compress subsets of samples into a single value to generate a smooth, estimated curve. Hits will be much easier to detect without so much noise (pun intended). Here is the general idea (although not an actual plot of an envelope):
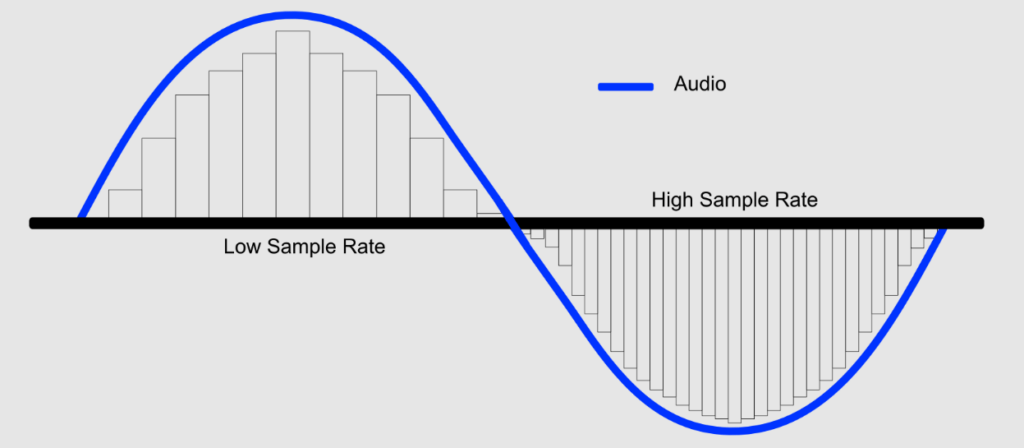
The rectangles are individual samples and the blue curve is what the envelope is trying to achieve. I computed the envelope using RMS windowing as suggested by Claude:
    for i in range(0, len(samples) - window_size, window_size):
        window = samples[i:i + window_size]

        index = i // window_size
        envelope[index] = np.sqrt(np.mean(window**2))
It’s important to remember that loudness in this case is measured as displacement from 0. An amplitude of -65536 is just as loud as 65536, so squaring is perfectly safe.
In order to detect a hit, I defined a threshold using our envelope (not the raw samples):
threshold = np.mean(envelope) * 1.2
How did I get to 1.2? A hit has to meaningfully deviate from the rest of the curve, but by how much? It’s unclear and there isn’t a single number that works well for all recordings. The script requires manual tuning based on the input, which limits its generalizability.
The same issue happens when classifying dynamics:
def calculate_dynamic(amplitude: float, ghost_percentile: float, accent_percentile: float) -> str:
    # ghost_percentile = 20th percentile
    if amplitude <= ghost_percentile:
        return 'ghost'
    # accent_percentile = 80th percentile
    elif amplitude >= accent_percentile:
        return 'accent'
    else:
        return 'normal'
Those numbers are arbitrary and simply seemed to work well.
It’s a good start but far from being useful. I’m curious how AI will improve this script.